Data Insights and visualization using Tableau for e-commerce in fashion industry
Client Background
The Leading Indian Fashion House based in India with an annual Sales of 600 crores, has over 270 brick and mortar store spread essentially over India, Mauritius and the United States.
The designing, manufacturing, marketing, e-commerce is all accomplished in house.
The Project
To identify gaps and opportunities in their e-com business using data visualization tools while addressing some of the hypotheses which are typically driven by experience and basic analytics.
The Scope
Build a POC using Tableau to help the fashion house visualize the potential of data based decisioning.
Two data sources (Majento & Google Analytics) have been blended to derive the output.
How Does It Help
The insights with interactive dashboards in Tableau will potentially helps make faster and more informed decisions while challenging any hypothesis based on existing available information .
Once the data is connected to the live sources, the fashion house will benefit from the increased speed and reliability of data.
Datasets Visualized
Results
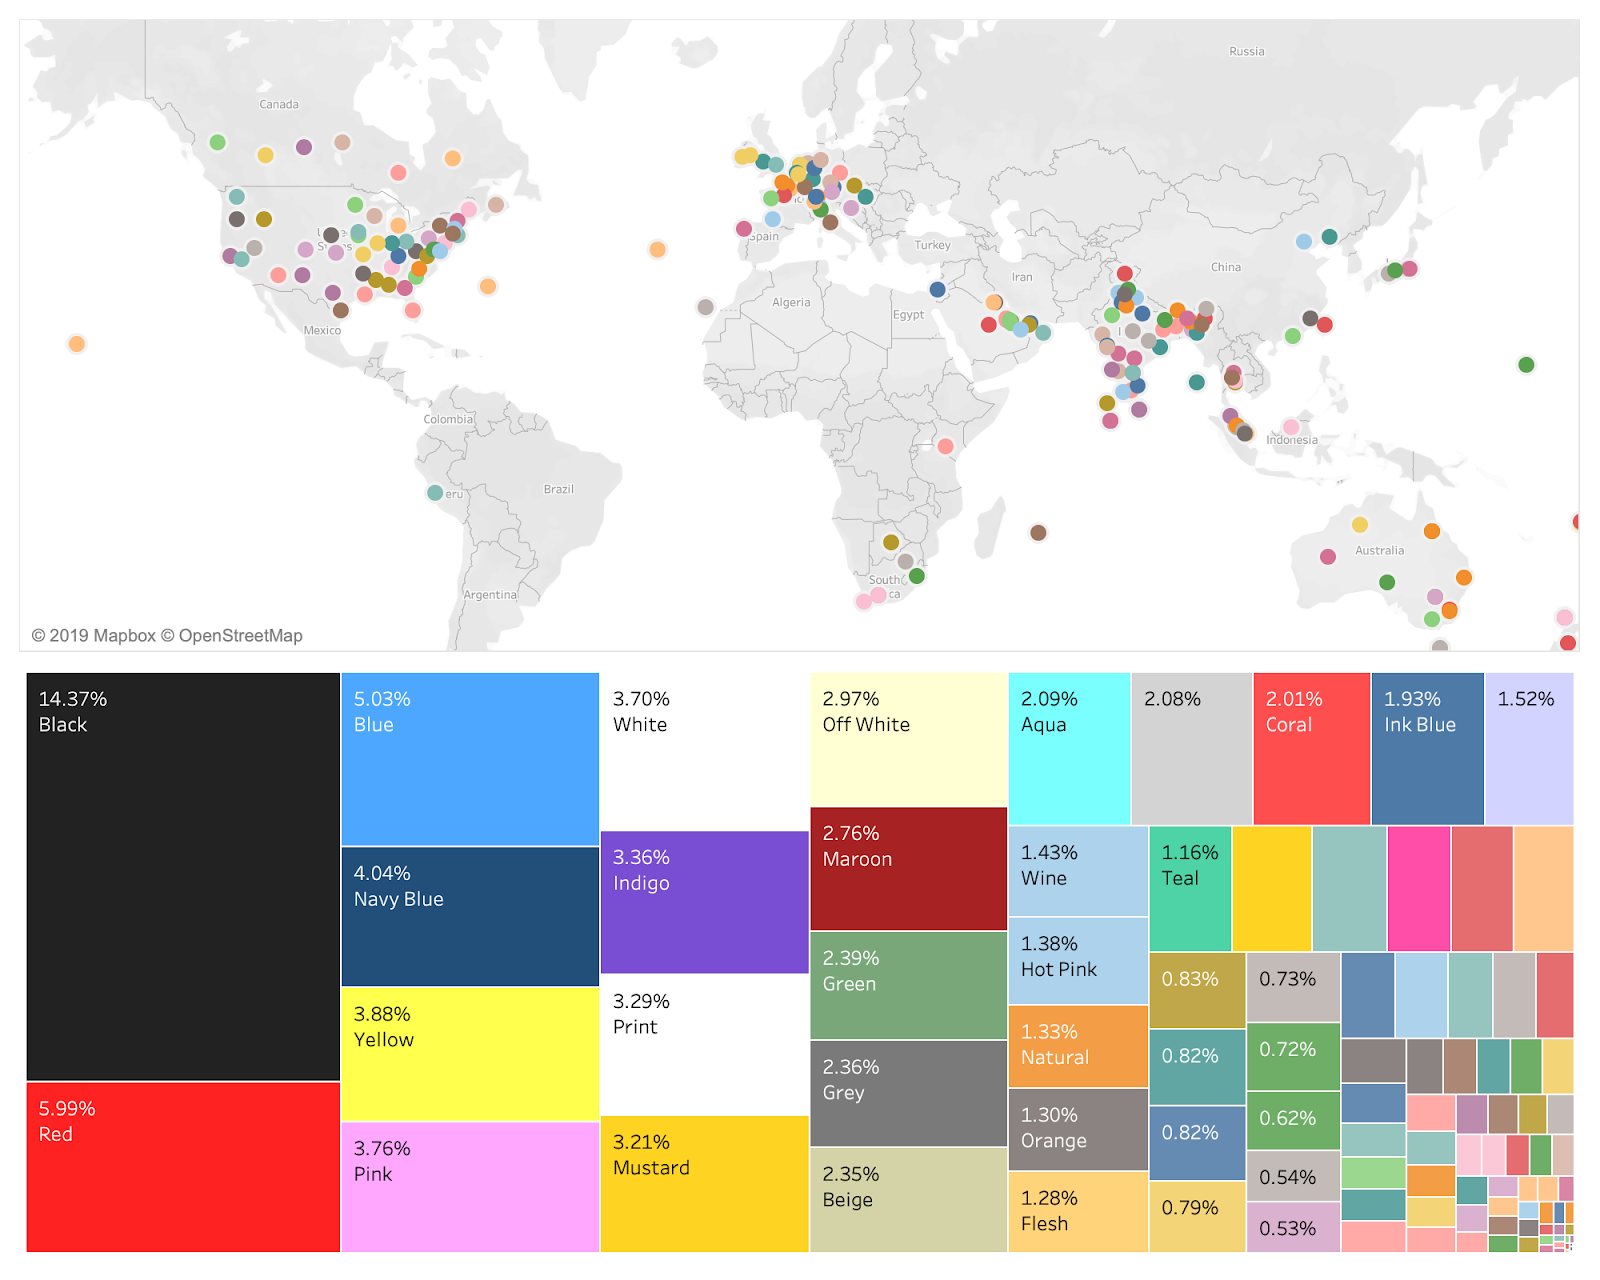
The Tableau interactive dashboards empowered the fashion retailer to get an overview for over 41,500 consumers at Geographic levels across 43 countries,196 states, 2,265 cities consuming a variety of over 7,300 plus products.
Consumer habits, price bands analysis ,correlations between several metrics were some of the interesting outcomes of this project , for example this color drives maximum revenue however does not contributes maximum profit, Brand A’s consumption is significantly different from Brand B in some states, focus of brand B in some territories may result in revenue gains with lesser effort comparatively.
Using Tableau, this project was a modest effort in identifying underlying opportunities related to fashion e-commerce with over 170K+ records having several touch points. Sample results can be viewed here.
Constraints & Notes:
For the purpose of this assessment, all use cases have been discussed in detail with the fashion designer. In a few cases, disagreement exists with interpretation of data based on ground reality.
The dataset used for public demo is limited to only 2 brands and a reduced sample size of 5000 transactional records.
Timeframe
Going Forward
The output of this POC will be discussed with the board members of the fashion house for due consideration in analyzing the scope of potential integration across all brands & channels of distribution.
Key Stakeholders